Onder het thema "overstroming" vind je informatie over de actuele en voorspelde overstromingstoestand in Vlaanderen.
Voor elk van deze subthema’s krijg je andere informatie te zien op de kaart.
We maken voorspellingen aan de hand van computermodellen. Die bootsen de fysieke kenmerken van een waterloop na en berekenen hoe het water door de bedding zal stromen. We baseren ons voor die berekeningen op de neerslagvoorspellingen.
 De permanentieverantwoordelijken (van het HIC) en operatoren (van de VMM) interpreteren de resultaten van deze modellen om er de meest relevante informatie uit te filteren. Deze interpretatie vind je terug in de waterinfoberichten.
Terug naar boven
De actuele toestand toont de metingen van waterpeilen en debieten. In de actuele thema’s worden enkel metingen en geen resultaten van de voorspellingsmodellen getoond.
Voor de meetstations waar drempels gedefinieerd zijn, verkleuren de symbolen op de kaart als bepaalde drempels zijn overschreden.
Voor de wachtbekkens die in het beheer zijn van VMM op de onbevaarbare waterlopen, wordt de
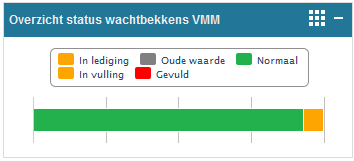
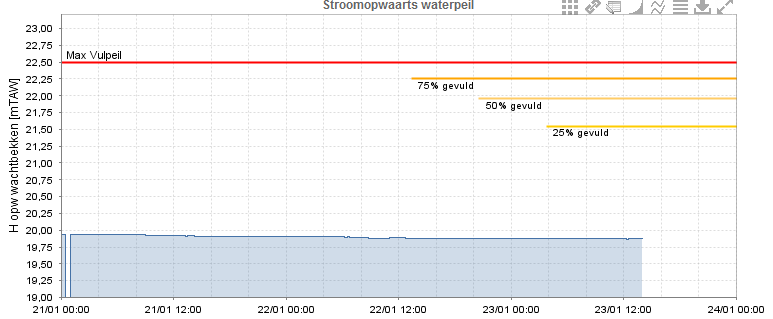
status wachtbekkens VMM berekend. Op de kaart verkleuren de symbolen voor de kunstwerken die de vulling van deze wachtbekkens regelen, mee met de status: normaal (groen), aan het vullen of ledigen (oranje), helemaal vol (rood). Op de detailpagina van de regelkunstwerken kan je dan bekijken in hoeverre de wachtbekkens reeds gevuld zijn.
Terug naar boven
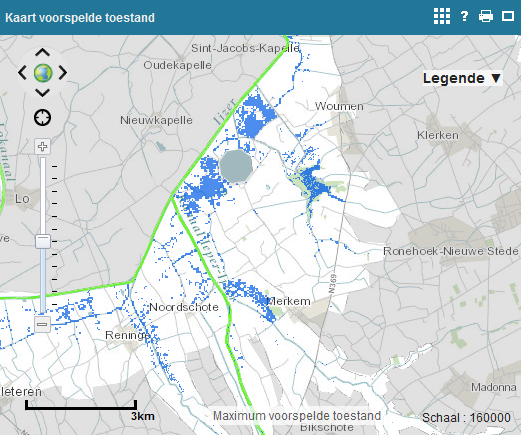
De korte termijnvoorspellingen blikken tot 48 uur vooruit. Met behulp van de module tijdsanimatie kunnen de voorspelde overstromingscontouren (dit zijn de blauwe zones op de kaart) en vrijboorden (dit zijn de gekleurde dijken van de bevaarbare waterlopen) voor verschillende tijdstippen gevisualiseerd worden op de kaart. Hiervoor moet je wel voldoende ingezoomd zijn. Meet- en voorspellingspunten verkleuren in de thema's "voorspelde toestand" op basis van de voorspellingen (groen – geel – oranje – rood naar mate de ernst van de situatie toeneemt).

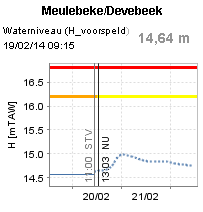
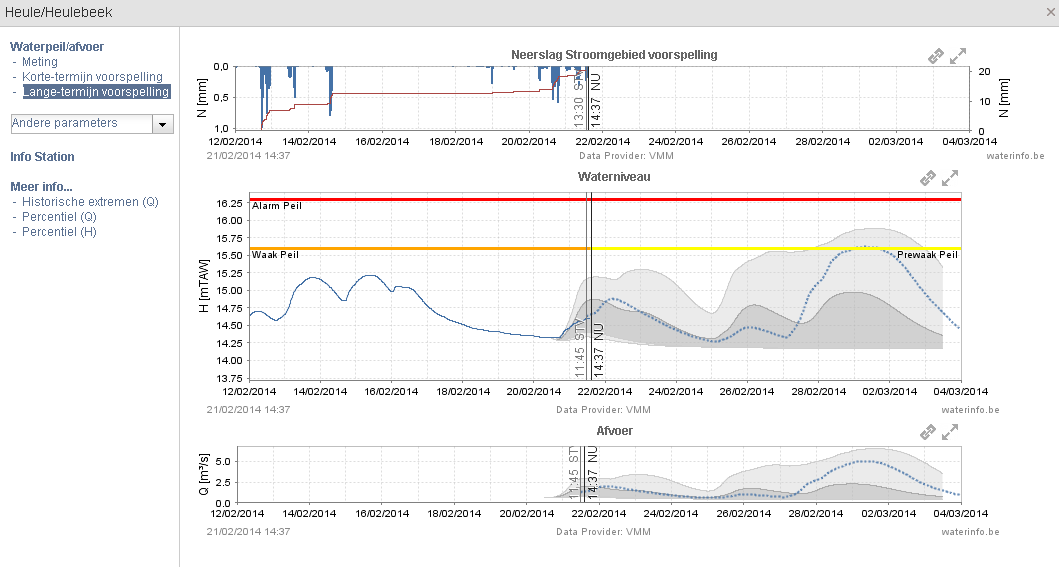
Op de grafieken onder de kaart worden de voorspellingen getoond met een stippellijn. Met behulp van een verticale lijn wordt de starttijd van de voorspelling (STV) aangeduid. Een tweede verticale lijn toont het actuele tijdstip (NU).
Als je de grafieken maximaliseert, verschijnt naast de stippellijn een band van voorspellingen. Deze geeft een indicatie voor de waarschijnlijkheid van de voorspelling op basis van verschillende neerslagvoorspellingen. De verkleuring van de dijken van de bevaarbare waterlopen op basis van de voorspelling of vrijboord wordt ook weergegeven op de kaart.
Terug naar boven
Lange termijnvoorspellingen berekenen we tot 10 dagen vooruit voor een selectie van locaties op de onbevaarbare waterlopen. Ook op deze grafieken wordt een band van voorspellingen gegeven, die een indicatie geeft van de waarschijnlijkheid van de voorspelling. Onzekerheidsbanden worden berekend met behulp van verschillende mogelijke neerslagvoorspellingen, die meer of minder neerslag voorspellen. Hoe breder de band en dus hoe verder de voorspellingen uit elkaar liggen, hoe groter de onzekerheid.
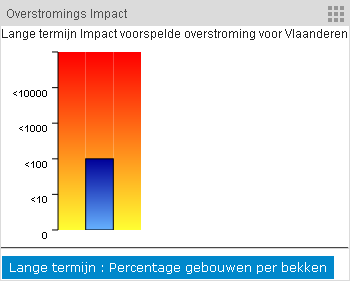 Voor professionele gebruikers is de module overstromingsimpact beschikbaar. Deze geeft weer voor hoeveel gebouwen er wateroverlast voorspeld wordt. Je kan ook de procentuele verdeling van deze totale impact over de verschillende rivierbekkens van Vlaanderen bekijken.
Terug naar boven