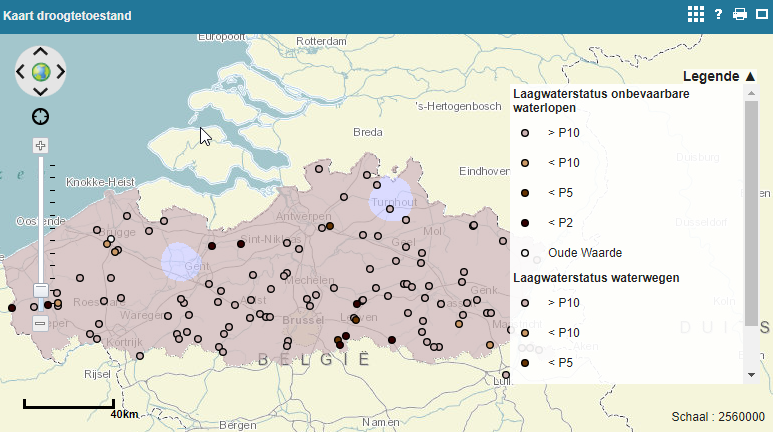
Aanhoudende droogte kan op vele gebieden nadelige effecten hebben. Landbouw, scheepvaart, aquatische ecosystemen, industrie en zelfs de drinkwatervoorziening kunnen in de problemen komen bij een lange droge periode.
Droogte en waterschaarste is een complexe problematiek. Lage afvoeren en peilen op de waterwegen en waterlopen (vorm van hydrologische droogte) zijn hier slechts één aspect van. Binnen de CIW (Coördinatiecommissie Integraal Waterbeleid) wordt het overzicht gehouden. Hiervoor kan u www.opdehoogtevandroogte.be raadplegen.
Op waterinfo.vlaanderen.be worden een aantal zaken aangeboden:
- een kaartweergave van afvoerdebieten op plaatsen waar de meetposten geschikt zijn om ook lage debieten correct te meten;
- een indicatie van lage afvoeren op meetlocaties door weergave van de Laagwaterstatus, gebaseerd op percentielen van de historische meetgegevens;

- de “Standardized Precipitation Index” (SPI) indicatoren met accumulatieperiodes van 1 maand (SPI-1) en 3 maanden (SPI-3) geven weer hoe droog of hoe nat de voorbije maand (SPI-1) en de voorbije 3 maanden (SPI-3) waren ten opzichte van dezelfde periode van het jaar in de voorbije 30 jaar te Ukkel. SPI-1 geeft dus de toestand op korte termijn weer, terwijl SPI-3 eerder de toestand op langere termijn (een seizoen) weergeeft. De SPI-3 kaart, gebaseerd op de gemeten neerslagstations van VMM, wordt weergegeven als achtergrondkaart op de droogtepagina.
Verder worden ook meer specifieke indicatoren gehanteerd en geïnterpreteerd in maandelijkse toestandrapporten. Voor de waterwegen wordt van april tot september, of zoals de situatie het vereist, een overzicht gemaakt in de laagwaterberichten, en in geval van droogte ook in droogteberichten. Deze berichten kunnen geraadpleegd worden onder het menu ‘’Rapporten’’.
Lees meer...